Blogs
Check out the latest topics & trends
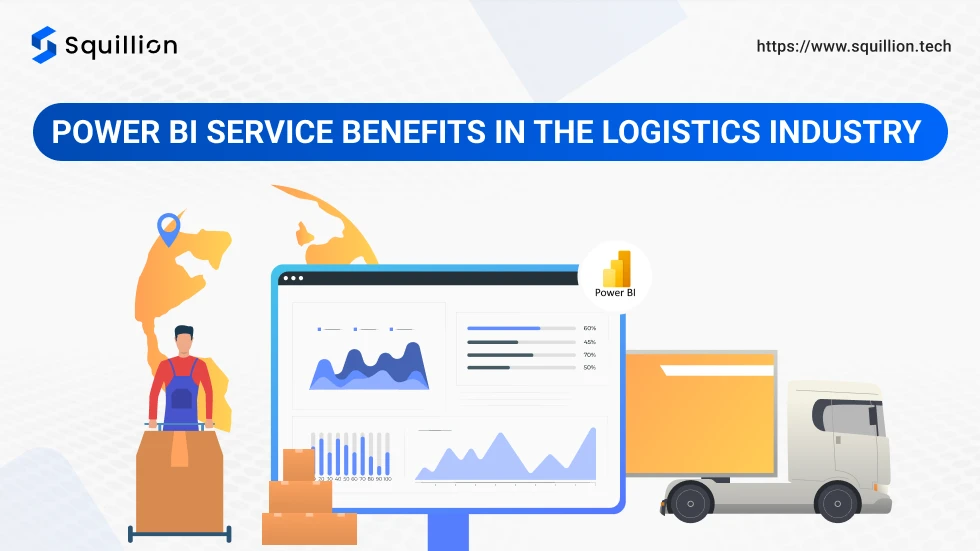
The logistics industry runs on data for efficient delivery, performance optimization, and many more metrics. Understanding these metrics better helps you enhance your customer satisfaction and profits.

The world is running on data, especially in business. Every decision, from production to marketing strategy, is based on data analysis. Microsoft Power BI is the industry leader in data visualizaiton and analysis because of its user-friendly interface and affordable pricing.
Do you ever see a spreadsheet full of data ready for you to analyze? The numbers are floating in the air, and you feel exhausted even before you start. Yes, we know that feeling too well. However, lucky us because you don’t have to analyze it anymore
If you want to grow your business or startup, you must track and analyze your data. It is so you can understand where you are performing well and where you are lacking.
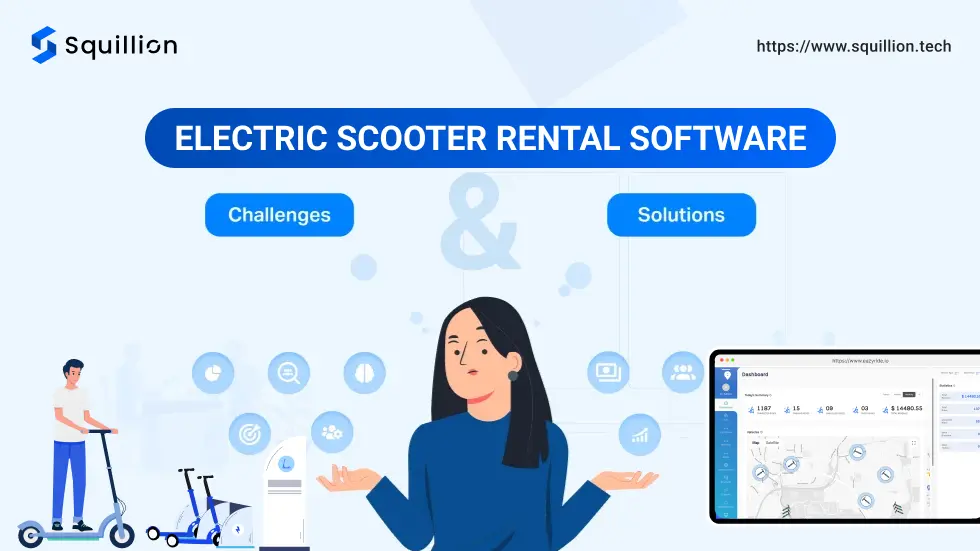
Are electric scooters good for the environment? Yes! Are people using e-scooters to commute in the city? Yes! Is there a demand for e-scooter rental businesses?
You are missing out on profits and customer engagement if you ignore your data. Yes, data is the most essential part of any business. You may not trust us, but trust this research that shows that the data industry has grown from $169 billion in 2018 to $348.21 billion in 2024.
Imagine going to a toy store as a kid and getting bombarded with many choices. It would have you excited and overwhelmed. The chances of choosing a toy you might not like later are high. Working with Power BI data visualization is similar
Demand is a volatile concept that changes per the users' needs. However, there is one thing that will never go out of demand, especially in this economy: affordable transportation. In modern cities, roads are buzzing with people and vehicles approaching their destination.

