Dynamics 365 CRM Analytics by Squillion
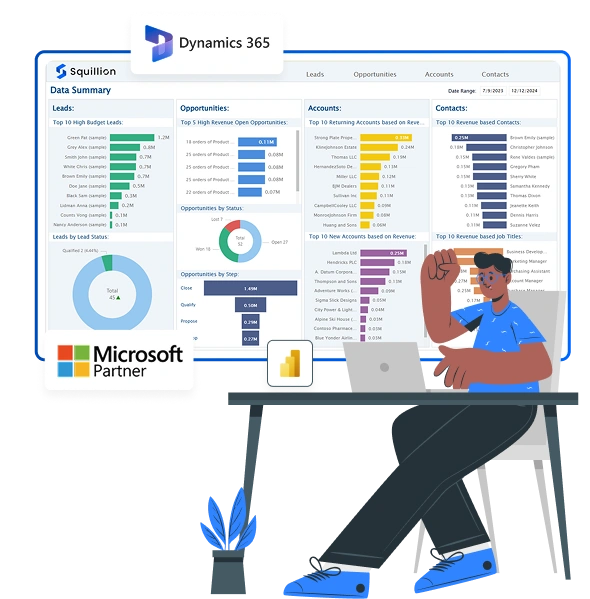
Dynamics 365 CRM is a powerful customer relationship management solution that helps businesses streamline their sales, marketing, and customer service processes. By providing a unified platform, it enables organizations to enhance customer engagement and drive growth.
Key Features

Unified Customer 360 View
Combine sales, service, and marketing data from Dynamics 365 CRM App by Squillion into one Power BI dashboard for complete customer insights.
Interactive Drill-Down Analytics
Use Power BI filters and drill-through to explore data by region, product, or account without leaving the dashboard.
Secure Role-Based Access
Protect sensitive CRM data with Power BI’s row-level security, ensuring each team member sees only their permitted records.
Real-Time Sales & Service Monitoring
Track leads, opportunities, and support cases live to address bottlenecks and improve response times.
Predictive CRM Insights
Leverage AI-driven forecasts to identify high-value leads, at-risk customers, and optimal next steps.
Custom Dashboard Templates
Start quickly with pre-built, industry-specific Power BI templates tailored for Dynamics 365 CRM App by Squillion. Easily customize layouts, visuals, and KPIs to match your unique sales and service processes.Tackling Challenges with Dynamic 365 CRM Insights
Challenge
- Businesses struggle to unify customer data across departments, leading to disconnected reports and inconsistent insights.
- Delayed access to sales and service information slows down decision-making and impacts customer satisfaction.
- Lack of automation in workflows results in manual tasks, reduced efficiency, and missed opportunities.
- Sales and marketing teams face challenges in tracking lead progress and campaign effectiveness.
- Limited real-time analytics makes it hard to adapt strategies quickly and stay competitive.
Our Solution
- Dynamics 365 CRM Analytics delivers:
- Unified view of sales, marketing, and service data
- Real-time insights into leads, pipelines, and customer behavior
- Smarter decisions with interactive dashboards
-
Features of the dashboard include:
- Real-time lead tracking
- Unified customer view
- CRM module insights
-
Benefits for marketing teams:
- Smarter lead targeting
- Better campaign results
- Higher conversion rates
-
Overall organizational impact:
- Boosts team alignment
- Improves customer focus
- Enables quick decisions
Dashboard Pages & Navigation
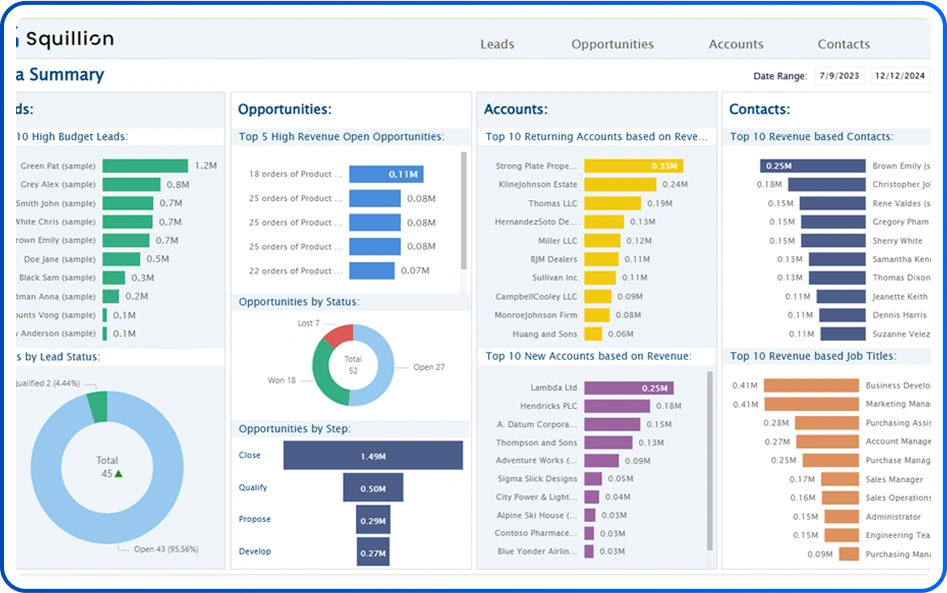
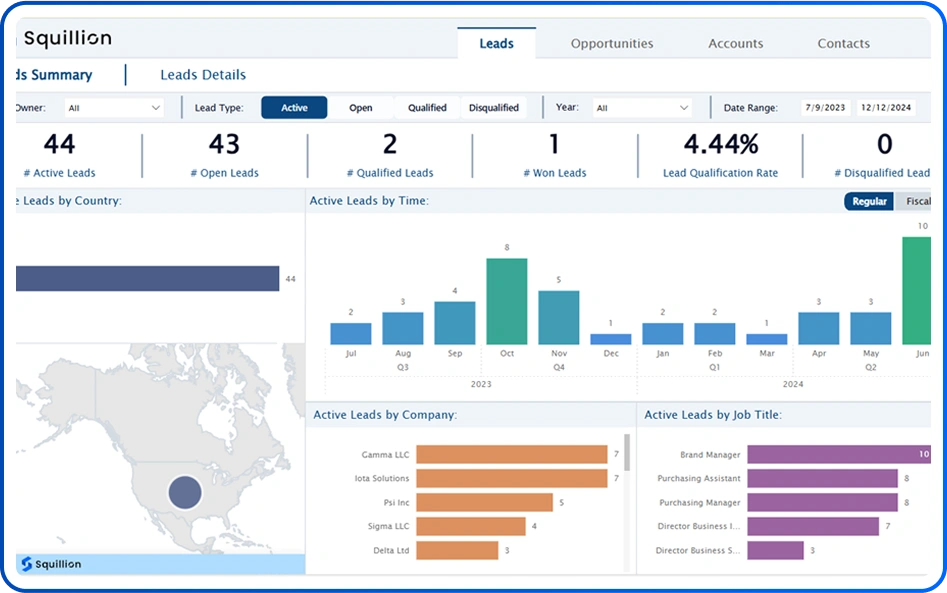
Leads Summary Page
Understand lead performance across your business. Track active lead counts, qualification rates, and source effectiveness over time. With Power BI filtering, you can compare lead trends by channel, region, or campaign helping your sales team focus on the highest-value opportunities.

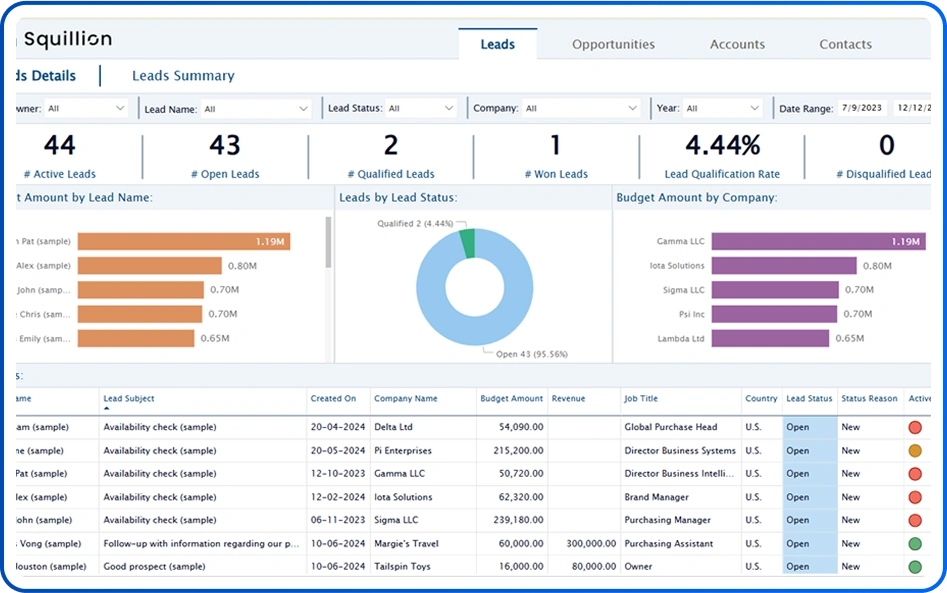
Leads Details Page
Dive into individual lead insights, including budget size, status, and company affiliation. This page provides your sales reps with the context they need such as lead age, next-step reminders, and estimated revenue potential to prioritize follow-up and boost conversion rates.Opportunities Summary Page
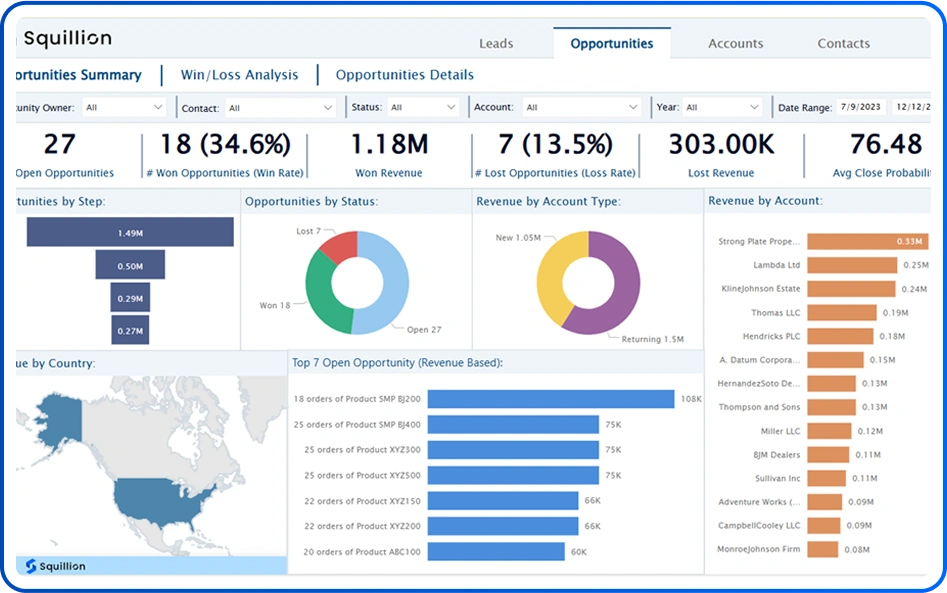
See all sales opportunities at a glance. Monitor total pipeline value, stage distribution, and win probability to understand where deals stand. Power BI’s dynamic visuals highlight revenue concentration by segment and help forecast future sales with confidence.
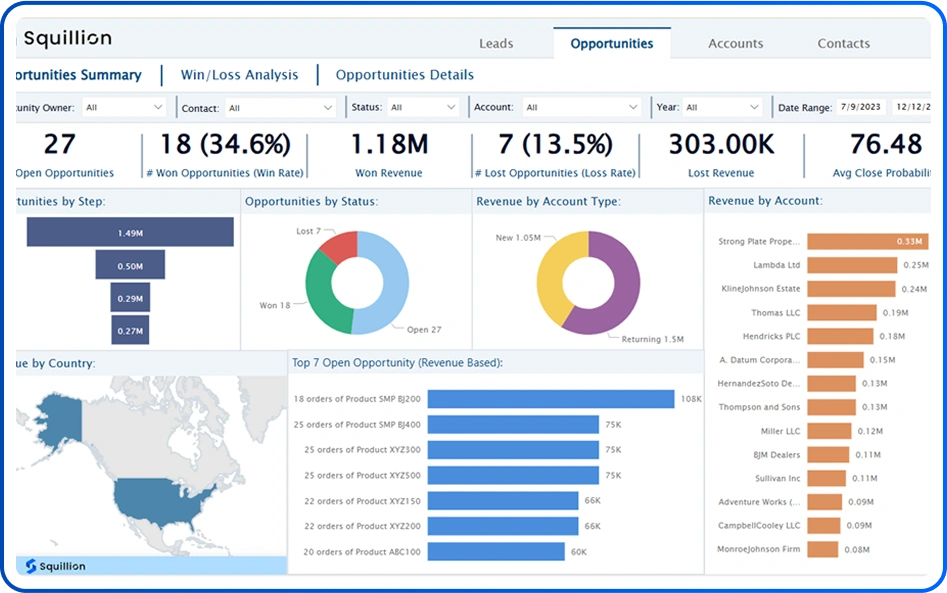

Opportunities Summary Page
See all sales opportunities at a glance. Monitor total pipeline value, stage distribution, and win probability to understand where deals stand. Power BI’s dynamic visuals highlight revenue concentration by segment and help forecast future sales with confidence.
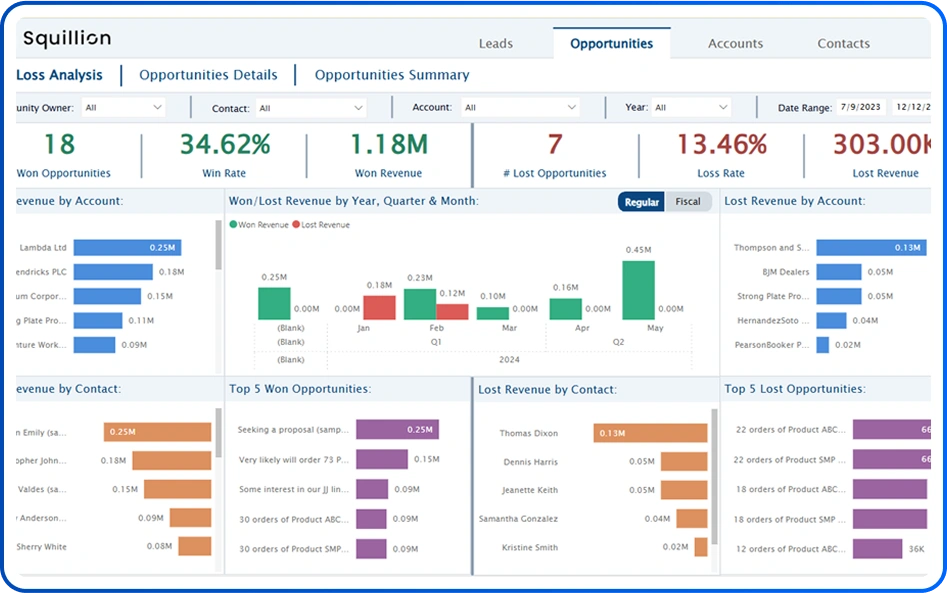
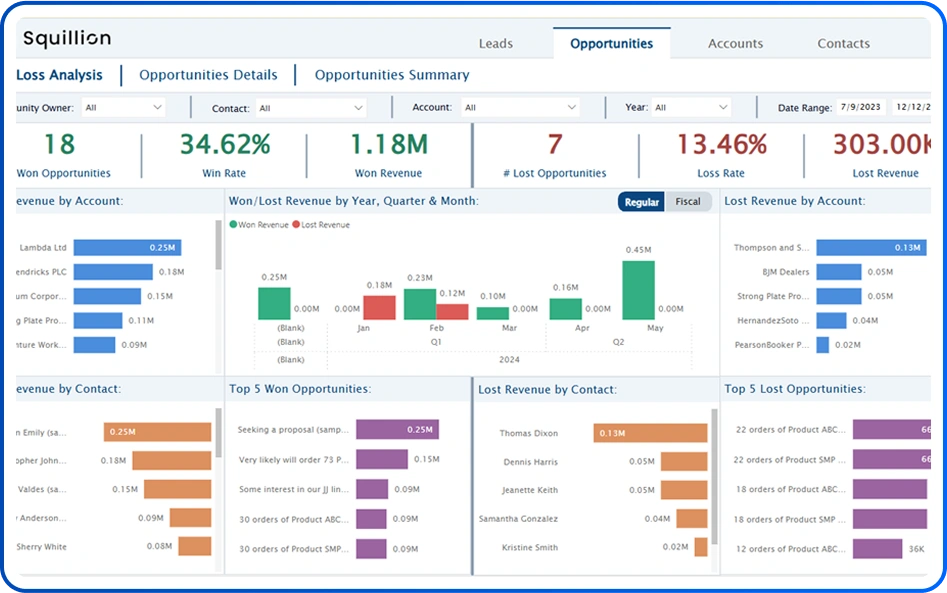
Win/Loss Analysis Page
Learn why deals close or don’t. This report breaks down won vs. lost opportunities by reason codes, sales representative, or product line. By surfacing common win patterns and loss drivers, you can refine sales tactics and messaging for higher success rates.Opportunities Details Page
Explore the journey of each opportunity from creation to close. View estimated deal size, probability, and timeline for won and lost deals. Combining these details with historical trends helps improve your revenue forecasting and sales strategy.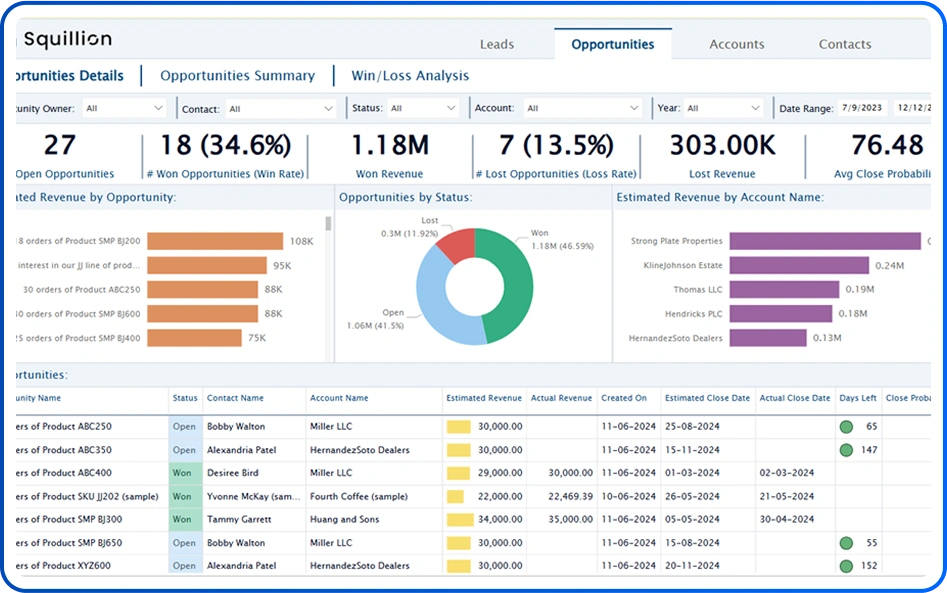

Opportunities Details Page
Explore the journey of each opportunity from creation to close. View estimated deal size, probability, and timeline for won and lost deals. Combining these details with historical trends helps improve your revenue forecasting and sales strategy.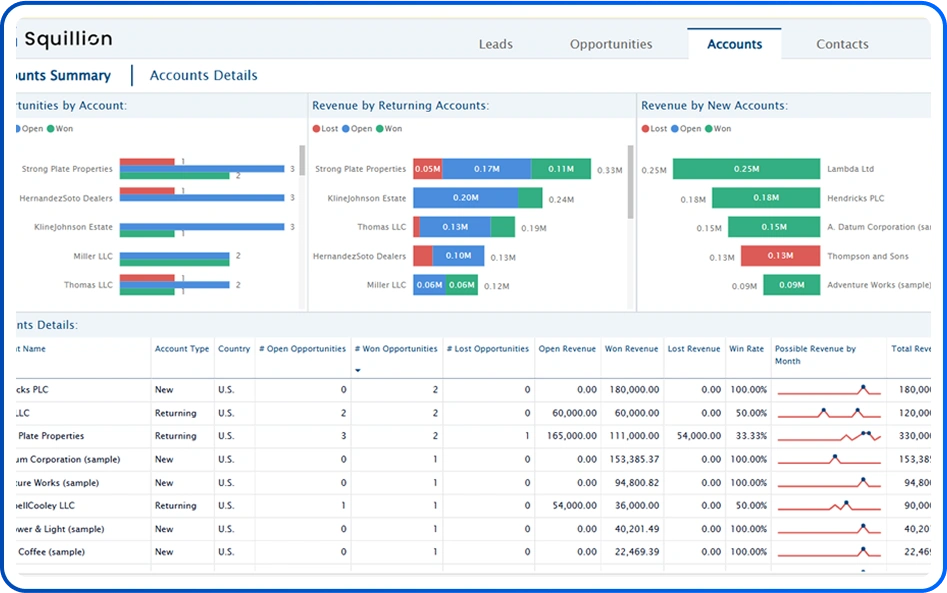
Accounts Summary Page
Get a consolidated view of all customer accounts. Track new vs. returning accounts, total account value, and open opportunity counts. This Power BI report helps your team identify high-value clients and prioritize account-based strategies.Accounts Details Page
Examine each customer account in depth. See current deal pipeline, past purchase history, and engagement metrics all in one Power BI page. With this insight, you can tailor outreach plans, strengthen relationships, and grow upsell revenue.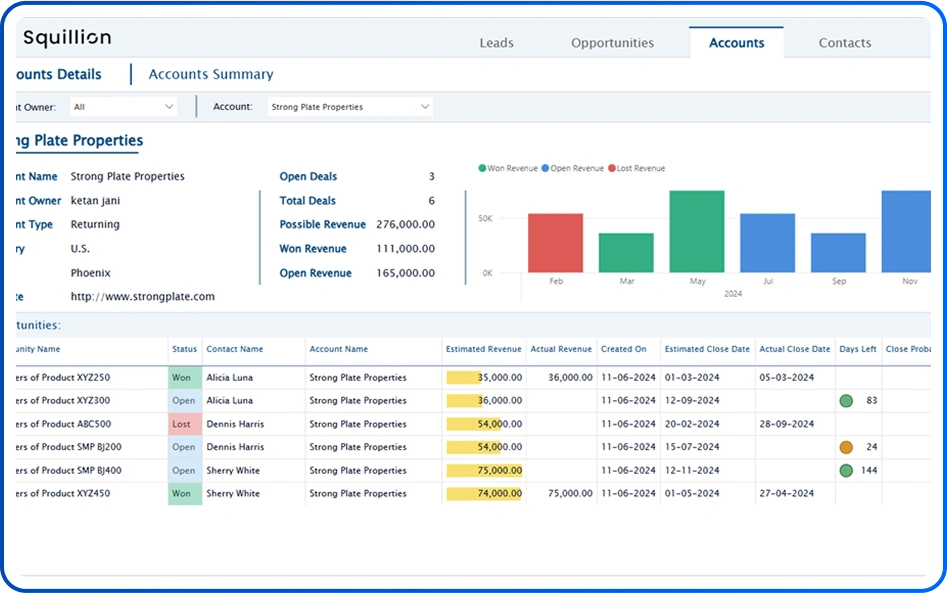

Accounts Details Page
Examine each customer account in depth. See current deal pipeline, past purchase history, and engagement metrics all in one Power BI page. With this insight, you can tailor outreach plans, strengthen relationships, and grow upsell revenue.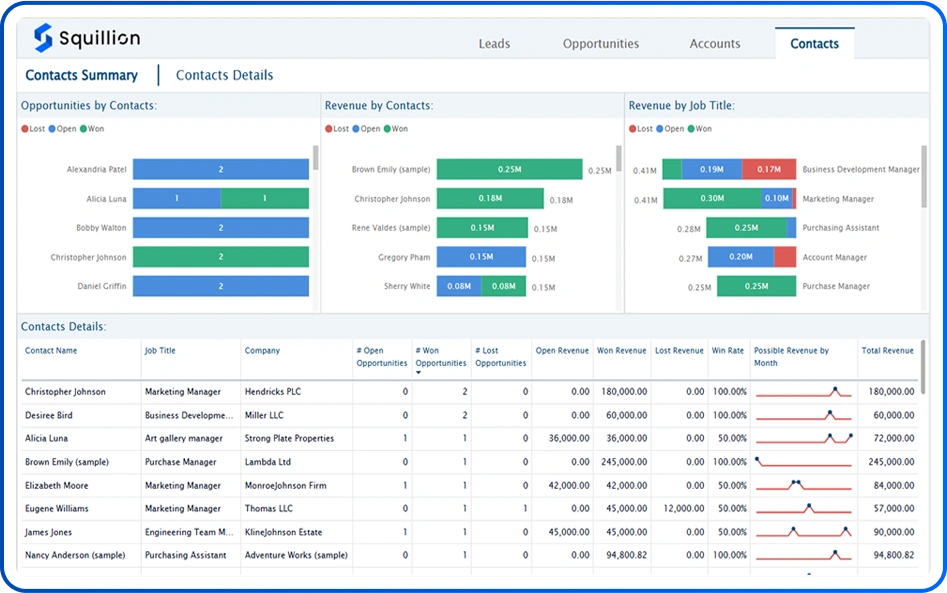
Contacts Summary Page
Analyze sales activity by contact and role. Measure revenue contribution, open opportunity counts, and engagement levels across your contact database. This summary report helps you identify which stakeholders drive the most value.Contacts Details Page
Focus on individual contact performance. Track their associated opportunities, deal status, and total revenue potential. This detailed view equips sales reps with the customer context they need to personalize communication and accelerate deal closures.
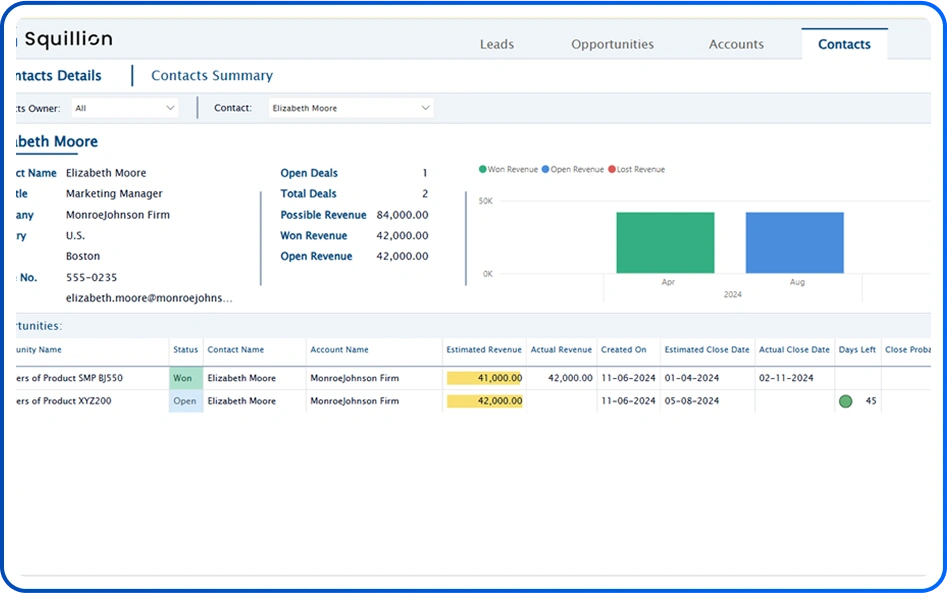

Contacts Details Page
Focus on individual contact performance. Track their associated opportunities, deal status, and total revenue potential. This detailed view equips sales reps with the customer context they need to personalize communication and accelerate deal closures.
Key Insights

At-Risk Customer Alerts
Identify customers showing low engagement or rising support needs to prevent churn.

Top-Performing Sales Segments
Discover which regions, products, or sales representatives deliver the highest win rates.

Service Efficiency Metrics
Measure average case resolution time and first-contact resolution to optimize support workflows.

Campaign Effectiveness
Correlate marketing spend with lead generation and conversion to improve ROI.

Sales Cycle Analysis
Understand average time-to-close and remove bottlenecks for faster deal closure.

Customer Lifetime Value Trends
Track LTV by segment to focus on high-value accounts and grow revenue.

Cross-Sell & Upsell Opportunities
Use purchase histories and engagement patterns to recommend relevant products or services.

Lead Conversion Insights
Visualize the complete lead journey from initial contact to closed deal using Dynamics 365 CRM data in Power BI. Identify drop-off points and optimize each stage to boost conversion rates.
FAQs
What is Dynamics 365 CRM Analytics by Squillion App?
It’s a powerful analytics solution designed by Squillion App to help you visualize and analyze your Dynamics 365 CRM data using interactive dashboards and real-time insights.
Who should use this dashboard?
Sales teams, marketing professionals, support teams, and business managers can all use the dashboard to make better decisions based on CRM data.
What do I need to use this app?
You need access to Dynamics 365 CRM (Sales Hub) and a Licensed account in Power BI Service.
Can I customize the visuals?
Yes, the app supports extensive customization to suit your unique business needs.
Does it support advanced CRM data?
Absolutely! The app is designed to integrate seamlessly with Dynamics 365 CRM for advanced analytics.
What kind of CRM data can I track?
You can track leads, opportunities, sales pipeline, customer engagement, support tickets, email performance, conversion rates, and more.
Who should use this dashboard?
Getting started is easy! To replace the demo data with your own Dynamics 365 data, follow the steps below: Installation Instructions Login to your Dynamics 365 Account Navigate to Settings > Advanced Settings Click on Settings Select Customizations from the dropdown under the Customization section Click on Developer Resources Locate and copy the Service Root URL Paste this URL into the D365_Web_URL parameter field in the dashboard Set the authentication method to OAuth2 Click “Sign in and Connect” Once connected, your data will replace the demo data and your dashboard will reflect your own Dynamics 365 CRM insights in real-time.


