Do you ever see a spreadsheet full of data ready for you to analyze? The numbers are floating in the air, and you feel exhausted even before you start. Yes, we know that feeling too well. However, lucky us because you don’t have to analyze it anymore. Instead, all you have to do is look at the data visualization dashboard, and you know what your data implies. That’s the power of data visualization; it makes understanding and analyzing data easier to save your time and energy and make better decisions on the go. We will discuss data visualization: its benefits, challenges, and how you can set up a data visualization system.
What is data visualization?
We tend to remember what we see more than what we read. Remember when we used to remember the page and the paragraph of specific topics in school? That’s an example of visual memory. Data visualization is the process of converting your numerical data into a visual display using various charts and graphs. It is the most straightforward process of understanding data and ensuring error-free data analysis. It helps you streamline the data analysis process, visualize your data, and understand the position of your operations to make better decisions.
Whether you are an established business or a startup, you need to manage your data well. Data analysis and visualization can help you ditch the hassle of scrolling through the sheets to draw valuable insights. Let’s understand more about data visualization.
What are the benefits of data visualization?
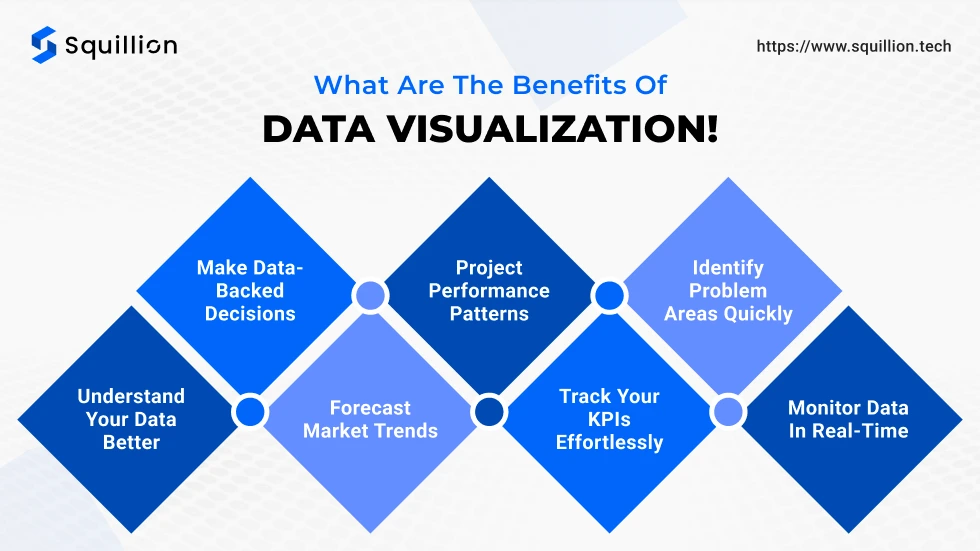
There are various benefits of visualizing data using visualization tools like Power BI. A Power BI consulting company can help you get the best of Power BI to analyze and visualize your data. The following are the advantages of data visualization:
Understand your data better
Do you remember in the geography of economics class, a map or chart will help us understand the theory better than a paragraph of complex words and percentages? That’s the power of data visualization. The data is converted into graphs and charts, helping us understand the data insights. It is helpful for anyone who doesn’t have to deal with the nitty-gritty of the data analysis process, like the shareholders, upper management, or other teams.
Make data-backed decisions
The most crucial factor in making effective business decisions is understanding your situation better. Assumptions can make your plan fail miserably. Data often gives direct insights into your market standing, performance, and problem areas. Therefore, with data visualization, you can find real-time data and compare it as needed to make the final decision. For example, Map By Squillion is our top custom visual developed to help you track your performance in various areas. By tracking area-based performance, you can differentiate your firm from weaker markets and create strategies based on it.
Forecast market trends
The data visualization tools are equipped to understand past trends and predict future trends. Therefore, with past data and predictive tools, you can forecast the demand for a product. You can identify market trends in the early stages to create effective strategies leading to a competitive edge.
Project performance patterns
Managing a project is easier said than done. However, with data visualization, you can track the progress and performance of the project quickly with a few clicks. With tools like Power BI, you can track customer behavior from various sites, create charts, and draw insights. Power BI Service Providers will help you set up the Power BI system so that it directly updates the dataset and gives you real-time insights on each aspect of your project. Whether it’s about resource allocation or digital marketing performance, data visualization helps you track the growth and performance of your project.
Track your KPIs effortlessly
Appraisal season can be daunting if you don’t know how well each of your departments has been performing. Therefore, you can rely on data visualization to track your KPIs based on each department. You can link it to your employee base to track their performance. The real-time insights help you identify where you need to take immediate action.
Identify problem areas quickly
Data visualization can help you track each nitty-gritty aspect of your business or project. Therefore, identifying the problem areas becomes much better. By tracking the progress over a long duration, you can identify the patterns, draw insights, and identify the areas causing the problem. It could be a department or external problem that could cause you delay or loss. Therefore, data analysis and relevant visualization tools can help you understand your operation performance and identify the problem area effortlessly for optimum resource utilization.
Monitor data in real-time
There are times when swift action is needed. In such a situation, a lack of access to data and insights increases the chances of making a wrong decision. Therefore, data visualization is essential to help you understand your data quickly and get insight with real-time interaction (sorting and filtering data). With tools like Power BI, stakeholders, and upper management can keep an eye on key metrics and make timely adjustments to strategies.
What are the common challenges faced in data visualization?
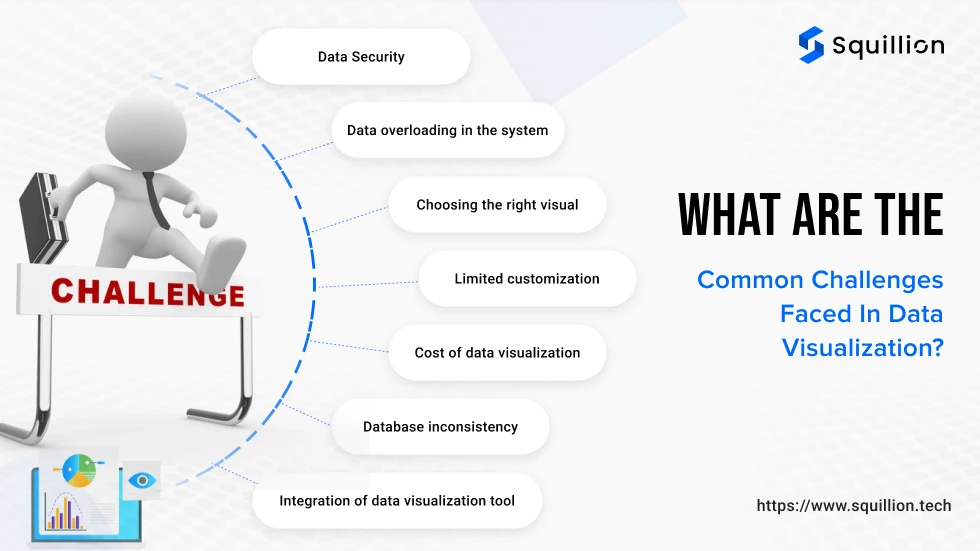
We understood the benefits of data visualization. However, many challenges accompany the process. But with the help of your expert Power BI consultants, you can tackle these challenges easily. Let’s take a look at some of the most common challenges faced by companies when using data visualization tools like Power BI.
Data Security
Data is a sensitive asset for the company. When you are using the data for visualization, you put your data at risk. There is a chance that there could be a leak. However, you can quickly resolve this issue with the data governance protocol offered by most data visualization tools like Power BI. The feature helps you safeguard your data while using data visualization. For example, setting up role-based access can help you narrow down the list of people who can access the data sets for easier control over data.
Data overloading in the system
Accurate data visualization is only possible if the data set is functioning well. Thus, you should avoid overloading your database with unorganized data. Simplify the extraction of data from the source and simplify data organization to avoid clustering the data. It helps you set up clean and organized data sets to streamline the data visualization process. Thus, you can avoid any manual errors and get an accurate visual dashboard.
Choosing the right visual
If we were to show you area-based performance for your company, we could use various data visualizations, such as graphs, pie charts, or maps. While each of these visuals will help you understand your performance in various locations, the understanding could become complex in a few. Graphs are not the best match for this, but a live map can help you understand data interpretation better. Similarly, for various KPIs, there are specific visuals to understand its performance better. Relying on expert data visual developers can help you select the most suitable chart for your data.
Limited customization
There are various data visualization tools in the market. These tools offer various types of data visuals to users for advanced data visualization and dashboard creation. However, businesses often need custom visuals to present their data better for tracking and decision-making. Lack of customization in data visuals can lead to ineffective dashboards with complex visuals. Custom visual developers, like Squillion Tech, help you create visually appealing dashboards with custom visuals designed to meet your needs and data sets.
Cost of data visualization
Data visualization tools are expensive. A startup or small business might find it difficult to invest a large sum in data visualization tools. However, working with data visualization experts can help you find affordable solutions to streamline your data analysis and relevant data visualization. Many data visualization tools offer affordable packages to help businesses of all sizes grow by understanding their data better.
Database inconsistency
One crucial benefit of data visualization is real-time data analysis. However, setting up a database with updated data is easier said than done. An expert like a Power BI service consultant integrates the data sources such that the data flow is consistent to avoid errors and inaccurate data visualization on the dashboards. You can update the database as and when necessary to ensure that your dashboards show accurate results to the user and make better decisions.
Integration of data visualization tool
The integration of a data visualization tool with your system is essential. However, developers often face difficulty integrating diverse data sources and your existing system with the visualization tool. This can lead to inaccurate results, incomplete visuals, and inefficient resource utilization, leading to loss. Therefore, data visualization experts like Squillion Tech can help you integrate a data visualization tool with your existing system and streamline your data analysis and visualization process.
How can Squillion Tech help you with data visualization?

Squillion Tech is a Microsoft Partner for expert Power BI Consulting Service. However, that’s not all we do. We create a strategic plan to help you streamline your data to extract desired visuals to track your performance and enhance your operations. For this, we have recruited top Microsoft-certified Power BI developers. These developers streamline your data analysis and visualization by creating datasets, extracting data, and using the correct chart for the Power BI dashboard.
Our expert Power BI developers can create a custom visual as per your needs. But why should you trust our developers? We are glad to tell you that one of our custom visuals, ‘Map By Squillion’, has been ranking among the top 50 visuals on Power BI visuals within 6 months of its launch. We were able to achieve this because of our skilled developers and their expertise in Power BI visuals. You can create your custom visual easily by hiring Power BI developers to meet your needs.
Conclusion
Data visualization can change how you analyze and understand your data. It helps you create a visual story from your data insights to make better decisions for your business growth. Forecast future trends, track performance, and identify problem areas quickly with data visualization tools like Power BI. Choosing the correct chart and maintaining data consistency are some of the significant setbacks of data visualization. Additionally, the security of data in visualization tools and its cost often make it challenging for small businesses and startups. However, when you work with expert data visualization consultants like Squillion Tech, you can expect affordable solutions with the best performance. If you need a custom visual to track your KPIs, Squillion Tech and our Microsoft-certified Power BI developers can help you create a custom visual per your requirements.
Gain a competitive edge by understanding what your data says with data visualization from Power BI. Book a meeting to learn how!

