


Microsoft Power BI Certified
Rest assured, Punchcard by Squillion meets the highest standards of quality, compatibility, and performance.

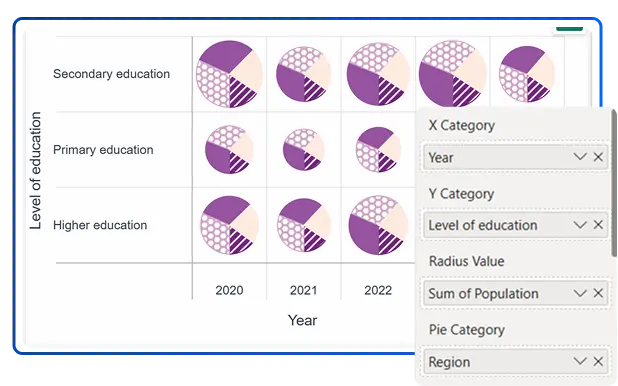
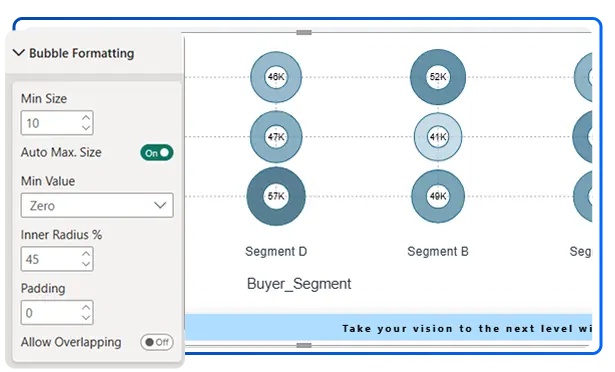
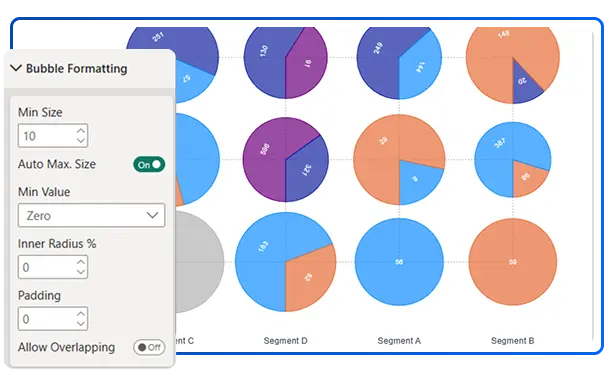
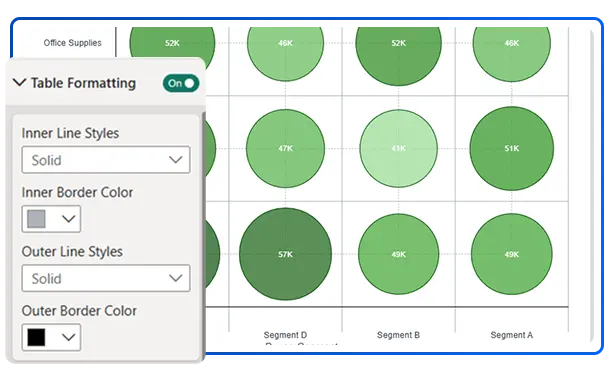
Customization Flexibility
Dive into a variety of fill options, formatting choices, and category support to create visuals that perfectly reflect your data's story.

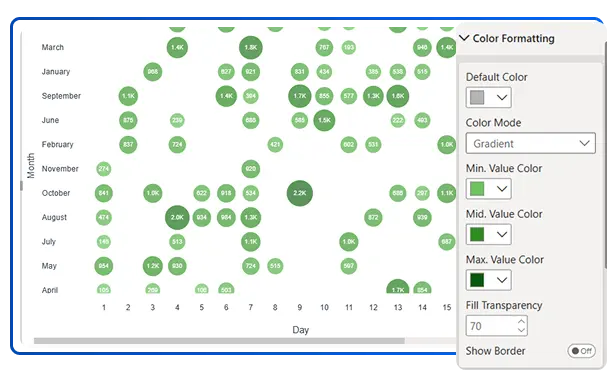
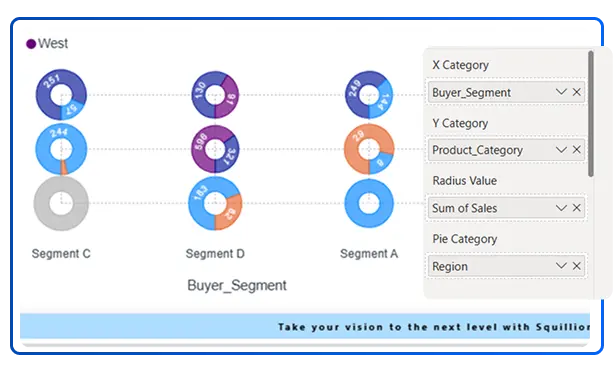
Enhanced Data Presentation
Transform your data into captivating visuals with advanced Punchcard features that engage and inform your audience.

Empower Decision-Making
Drive action and prompt discussions with visually appealing and insightful reports.

Faster Response Time
Experience a smooth and efficient user interface with optimized performance for real-time analysis.

Regular Updates
Benefit from consistent updates that improve performance, introduce cutting-edge features, and ensure compatibility with the latest Power BI advancements.